What is Monitoring?
Monitoring is the systematic process of collecting, analyzing, and using information to track the performance and health of systems, applications, and infrastructure. Effective monitoring helps in detecting issues early, ensuring system reliability, and optimizing performance. It involves tracking various metrics such as CPU usage, memory consumption, network latency, and error rates, allowing IT teams to maintain a proactive stance in managing their technology stack.
What are Metrics?
Metrics are numerical data points collected over time that provide insights into the performance and behavior of systems. These data points help in understanding the health, efficiency, and trends within an application or infrastructure. Examples of metrics include CPU utilization, memory usage, disk I/O, network traffic, and application-specific metrics like request rates and error counts. Metrics are crucial for identifying bottlenecks, diagnosing issues, and planning capacity.
What is Prometheus?

Prometheus is an open-source monitoring and alerting toolkit designed specifically for reliability and scalability. It was developed by SoundCloud in 2012 and has since become a part of the Cloud Native Computing Foundation. Prometheus is particularly well-suited for metrics monitoring due to its robust feature set and flexibility. It is widely adopted in the DevOps community.
Why Prometheus is Best Suited for Metrics Monitoring
- Time Series Database: Prometheus stores all its data as time series, which are sequences of data points indexed by time. This makes it highly efficient at handling and querying large volumes of metrics data over extended periods.
- Flexible Query Language: PromQL (Prometheus Query Language) allows users to perform complex queries on the collected time series data.
- Scalability: Prometheus is designed to handle large-scale environments, supporting both single-node and clustered setups. It can scrape thousands of targets and store millions of time series with efficient resource utilization.
- Integration and Extensibility: Prometheus integrates seamlessly with a wide range of systems and tools. It supports numerous exporters that collect and expose metrics from third-party applications, databases, hardware, and more.
Key Features of Prometheus
- Efficient Storage: Prometheus uses a custom time-series database optimized for high performance.
- Powerful Querying: PromQL allows users to slice and dice time series data to extract meaningful insights.
- Alerting: Prometheus has a built-in alert manager that supports defining alert rules based on metrics data.
- Flexible Data Collection: Prometheus supports various methods of data collection, including direct instrumentation, service discovery, and exporters.
How Prometheus Works
Prometheus operates by periodically scraping metrics data from configured targets. Here’s a high-level overview of how it works:
- Scraping: Prometheus collects metrics data by sending HTTP requests to targets (applications or services) that expose metrics endpoints.
- Storage: The collected metrics data is stored in Prometheus’s time-series database.
- Querying: Users can query the stored data using PromQL to generate dashboards and alerts.
- Alerting: Based on defined rules, Prometheus can trigger alerts if certain conditions are met.
What is Node Exporter?
Node Exporter is a Prometheus exporter that collects hardware and OS-level metrics from Linux and other Unix-like operating systems. It provides a wide range of system metrics, including CPU usage, memory consumption, disk I/O, network statistics, and more. These metrics are crucial for monitoring the health and performance of server infrastructure.
What is Scraping?
Scraping is the process by which Prometheus collects metrics data from its targets. Prometheus sends HTTP requests to the targets’ metrics endpoints at regular intervals to fetch the current state of metrics. The scraped data is then stored in the time-series database for querying and analysis. Scraping intervals can be configured to balance between data granularity and resource utilization.
What is Instrumentation?
Instrumentation is the process of adding monitoring capabilities to your applications and systems. By integrating instrumentation, applications can expose their metrics, making them available for collection and analysis by monitoring tools like Prometheus. This involves modifying the application code to include libraries or APIs that generate and expose metrics. Proper instrumentation is essential for gaining deep insights into application performance and behavior.
Practical: Setting Up Prometheus Server and Target on AWS
Let’s walk through a practical example of setting up a Prometheus server and target on AWS.
Step 1: Launch AWS Instances
- Launch EC2 Instances: Start by launching two EC2 instances, one for the Prometheus server and another as a target (e.g., running Node Exporter).
- Security Groups: Ensure that the security groups allow HTTP (port 9090) for Prometheus and the Node Exporter port (9100).
Step 2: Install Prometheus
- Download and Install Prometheus:
wget https://github.com/prometheus/prometheus/releases/download/v2.53.1/prometheus-2.53.1.linux-amd64.tar.gz
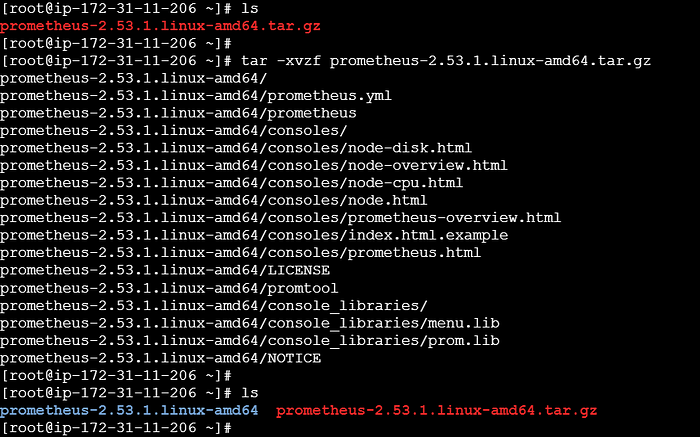
tar -xvzf prometheus-2.53.1.linux-amd64.tar.gz
cd prometheus-2.53.1.linux-amd64/
vim prometheus.yml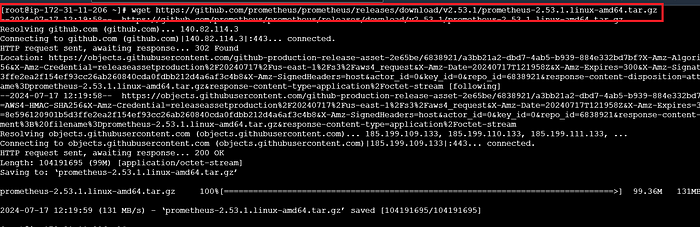

Step 3: Configure Prometheus
- Edit
prometheus.ymlConfiguration File:
scrape_configs:
  - job_name: 'prometheus'
    static_configs:
      - targets: ['localhost:9090']
  - job_name: 'Target-1'
    static_configs:
      - targets: ['<target-instance-ip>:9100']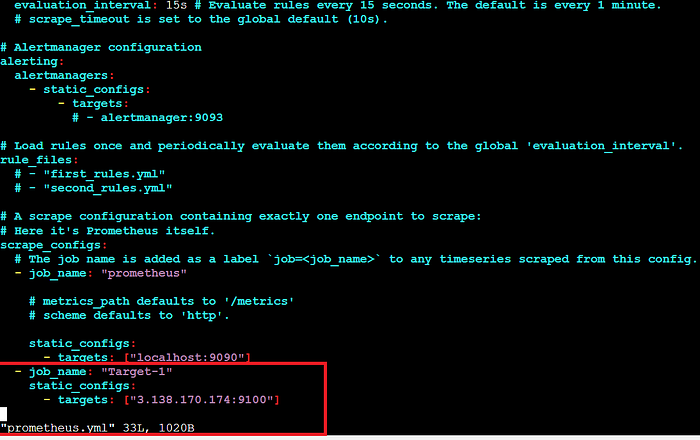
2. Start Prometheus:
./prometheus &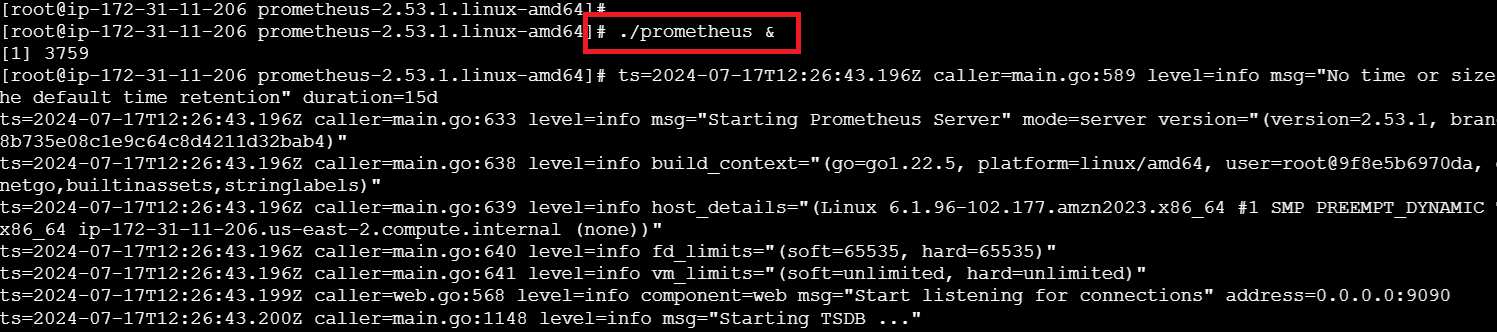
Step 4: Install Node Exporter on Target Instance
- SSH into Target Instance:
- Download and Install Node Exporter:
wget https://github.com/prometheus/node_exporter/releases/download/v1.8.2/node_exporter-1.8.2.linux-amd64.tar.gz
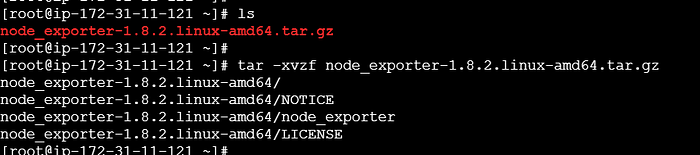
tar -xvzf node_exporter-1.8.2.linux-amd64.tar.gz
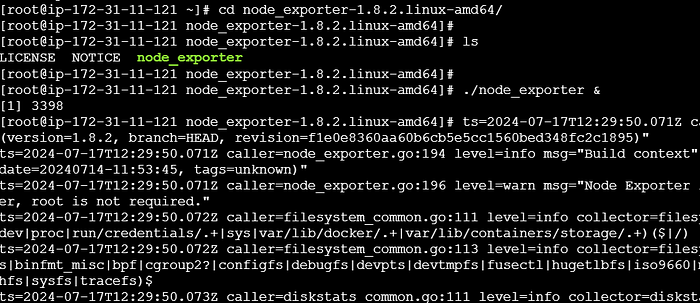
node_exporter-1.8.2.linux-amd64/
./node_exporter &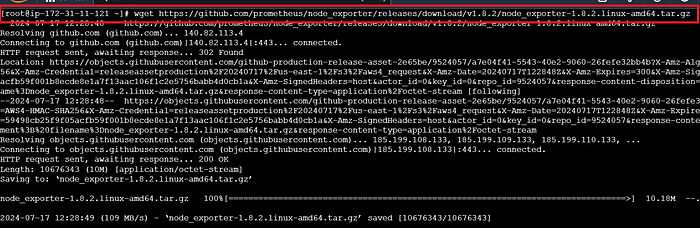
- Access the node-exporter metrics route at
http://<public-ip>:9100/metrics
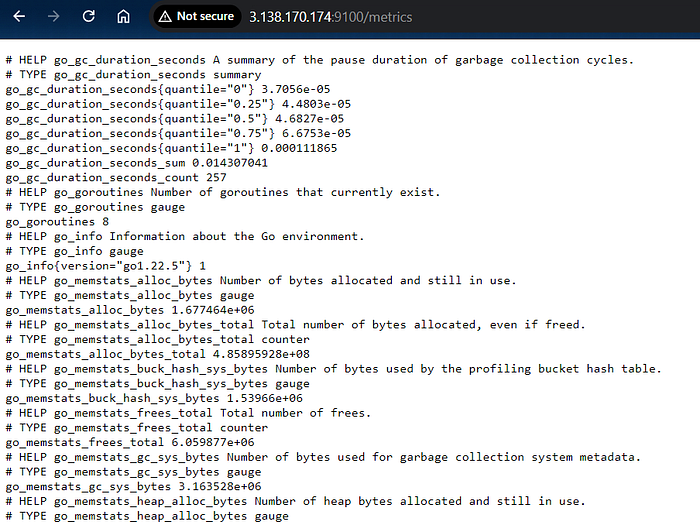
- It shows the real time metrics of the server. And this metrics are collected and stored by the prometheus server for analysis and alerting.
Step 5: Access Prometheus Web UI
- Open Browser: Navigate to
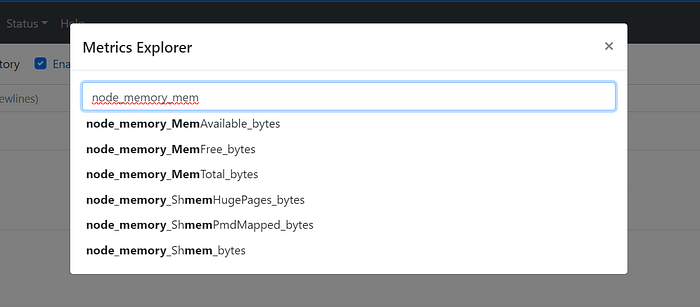
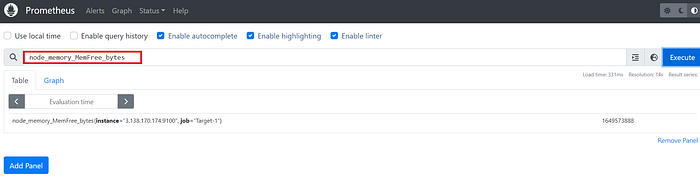
http://<prometheus-instance-ip>:9090. - Explore Metrics: Use PromQL to query and visualize the metrics collected from the Node Exporter.

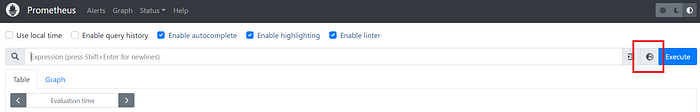
- Below are the list of explorers :
Conclusion
Prometheus is a robust monitoring solution that excels in collecting and analyzing metrics from diverse systems. With features like efficient storage, powerful querying, and flexible data collection, it provides a comprehensive toolset for ensuring system reliability and performance. Setting up Prometheus on AWS, combined with Node Exporter, demonstrates its practical application in real-world scenarios. By leveraging Prometheus’s capabilities, organizations can gain deep insights into their systems, enabling proactive maintenance and optimization.
