Building a DevSecOps Project: Automating Secure Software Delivery with Observability & Automation
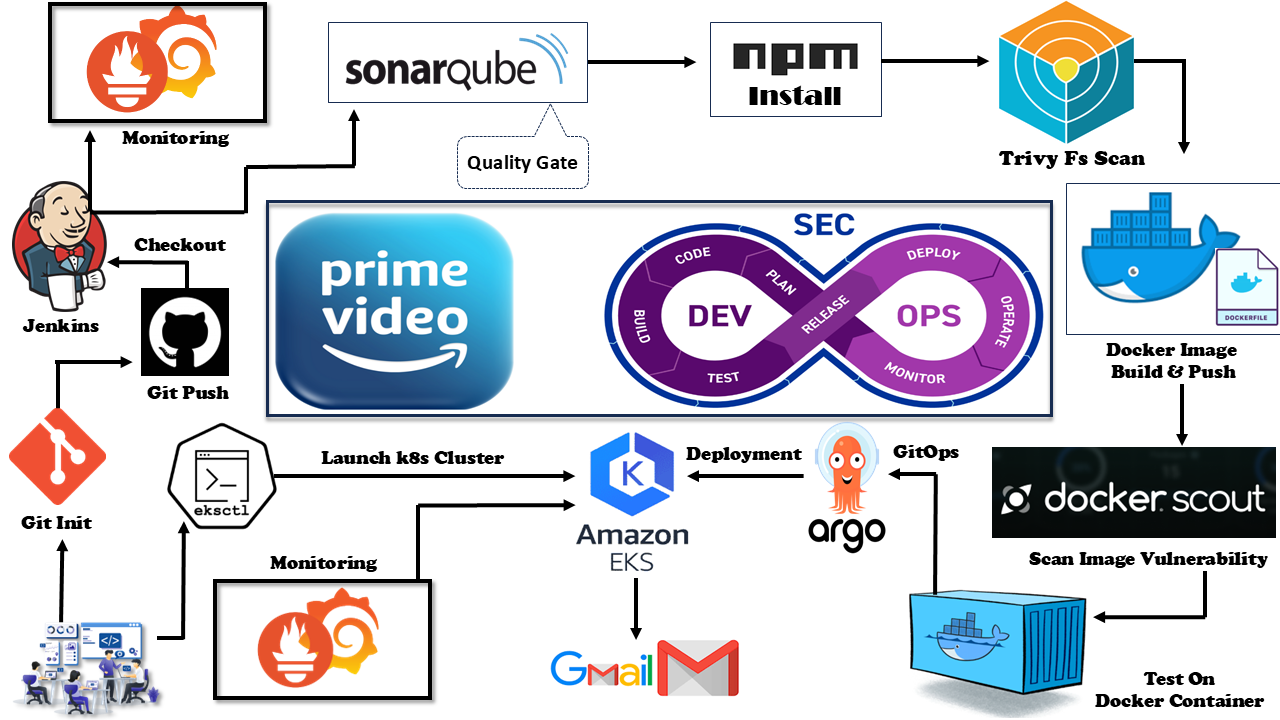
In this blog, we’ll take a deep dive into implementing a DevSecOps pipeline integrated with GitOps principles, enhanced security scanning, and robust monitoring. This end-to-end project showcases the deployment of an Amazon Prime Clone application using Jenkins, Docker, SonarQube, Trivy, Docker Scout, Prometheus, Grafana, Amazon EKS, and ArgoCD.
Step-by-Step Breakdown
Step 1: Setting Up the Foundation
Initial Setup
To get started, we prepared the environment by provisioning a Jenkins VM and installing essential tools. This included:
- Jenkins installation for continuous integration. Access it on
<vm_ip>:8080
#!/bin/bash
sudo apt update -y
wget -O - https://packages.adoptium.net/artifactory/api/gpg/key/public | sudo tee /etc/apt/keyrings/adoptium.asc
echo "deb [signed-by=/etc/apt/keyrings/adoptium.asc] https://packages.adoptium.net/artifactory/deb $(awk -F= '/^VERSION_CODENAME/{print$2}' /etc/os-release) main" | sudo tee /etc/apt/sources.list.d/adoptium.list
sudo apt update -y
sudo apt install temurin-17-jdk -y
/usr/bin/java --version
curl -fsSL https://pkg.jenkins.io/debian-stable/jenkins.io-2023.key | sudo tee /usr/share/keyrings/jenkins-keyring.asc > /dev/null
echo deb [signed-by=/usr/share/keyrings/jenkins-keyring.asc] https://pkg.jenkins.io/debian-stable binary/ | sudo tee /etc/apt/sources.list.d/jenkins.list > /dev/null
sudo apt-get update -y
sudo apt-get install jenkins -y
sudo systemctl start jenkins
sudo systemctl status jenkins
chmod +x jenkin.sh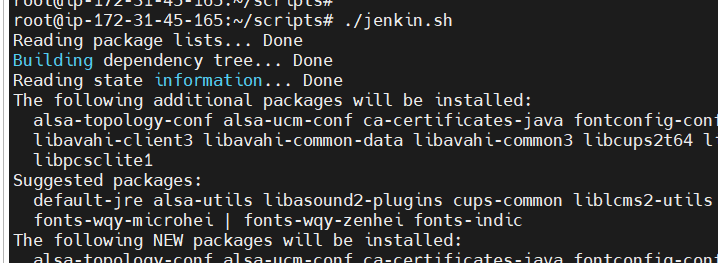
- Docker for containerization.
sudo apt install docker.io
sudo systemctl enable docker
sudo systemctl start docker
sudo chmod 666 /var/run/docker.sock- SonarQube for static code analysis. And access your dashboard at
<vm_ip>:9000
docker run -d --name Sonar-Qube -p 9000:9000 sonarqube:lts-community
- Trivy for vulnerability scanning.
sudo apt-get install wget apt-transport-https gnupg
wget -qO - https://aquasecurity.github.io/trivy-repo/deb/public.key | gpg --dearmor | sudo tee /usr/share/keyrings/trivy.gpg > /dev/null
echo "deb [signed-by=/usr/share/keyrings/trivy.gpg] https://aquasecurity.github.io/trivy-repo/deb generic main" | sudo tee -a /etc/apt/sources.list.d/trivy.list
sudo apt-get update
sudo apt-get install trivy
chmod +x trivy.sh
./trivy.sh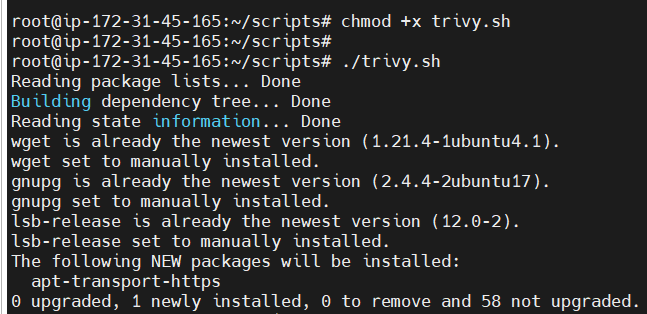
- Installing Docker-scout.
docker login -u <username> -p <password>
curl -sSfL https://raw.githubusercontent.com/docker/scout-cli/main/install.sh | sh -s -- -b /usr/local/bin
Additional tools introduced in this project include:
- Docker Scout for software composition analysis (SCA) and generating SBOM (Software Bill of Materials).
- Eclipse Temurin Installer for managing JDK versions.
- Prometheus Metrics Plugin for monitoring Jenkins performance.
- Email Extension Plugin for automated notifications.
Jenkins Configuration
- Installed plugins:

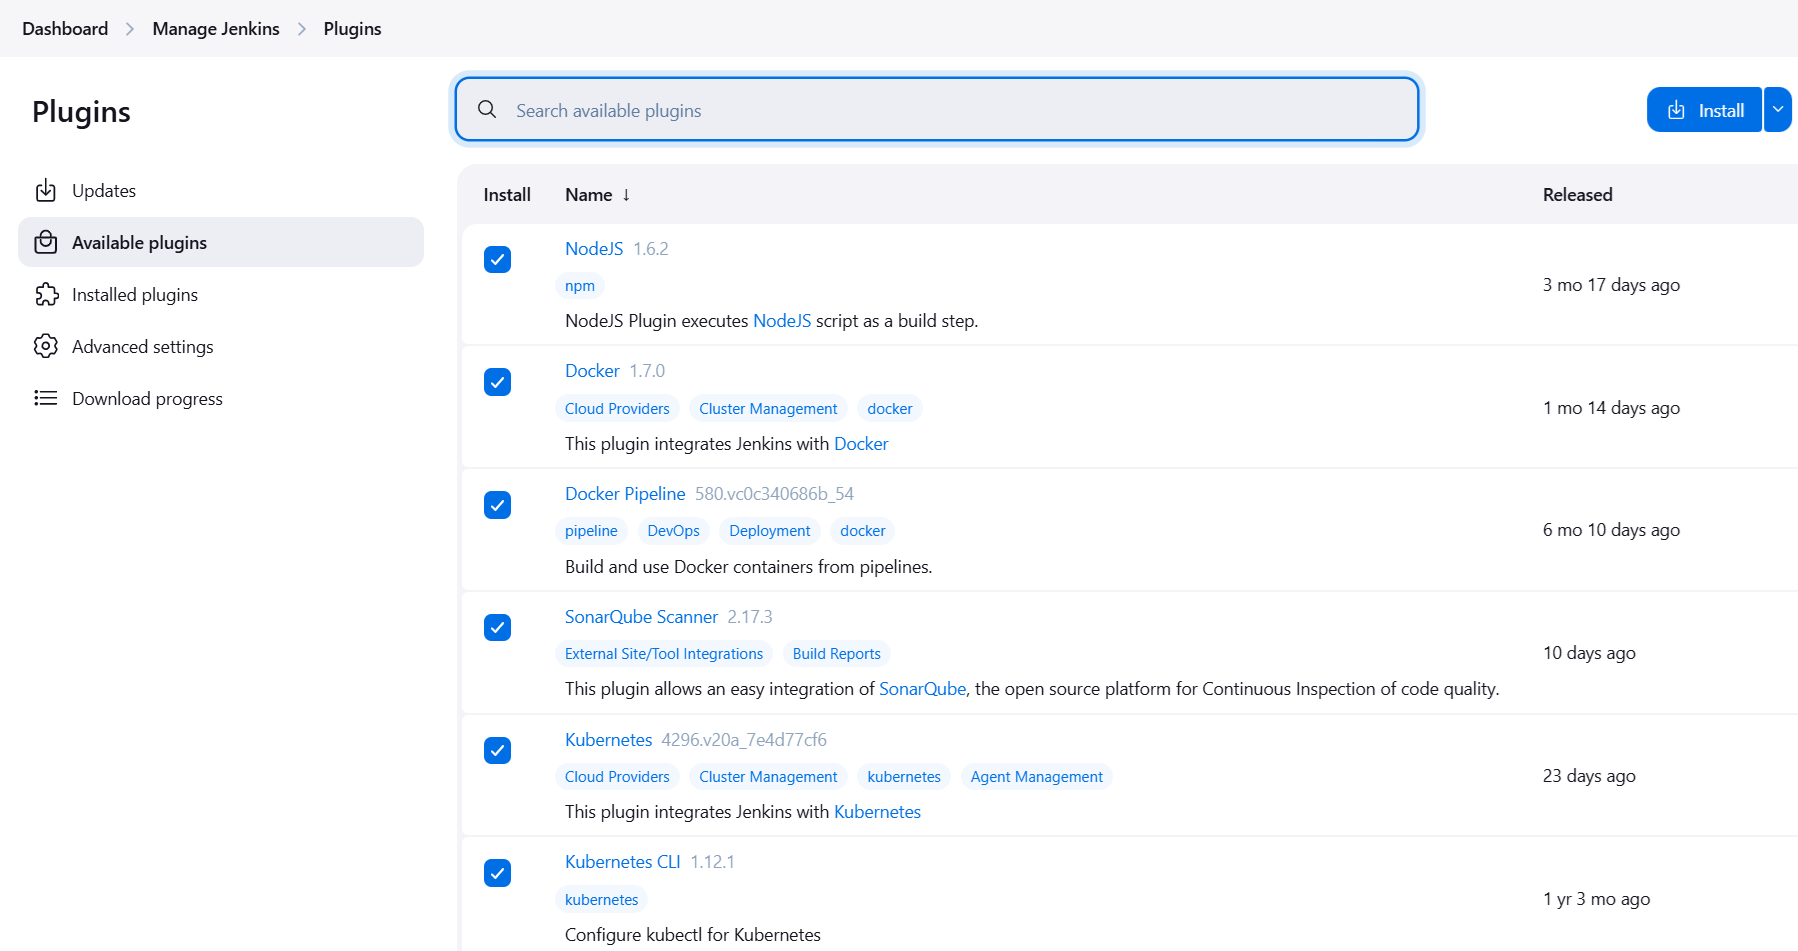

2. Configured tools:
- JDK (Temurin JDK 17) for Java-based SonarQube scanner.

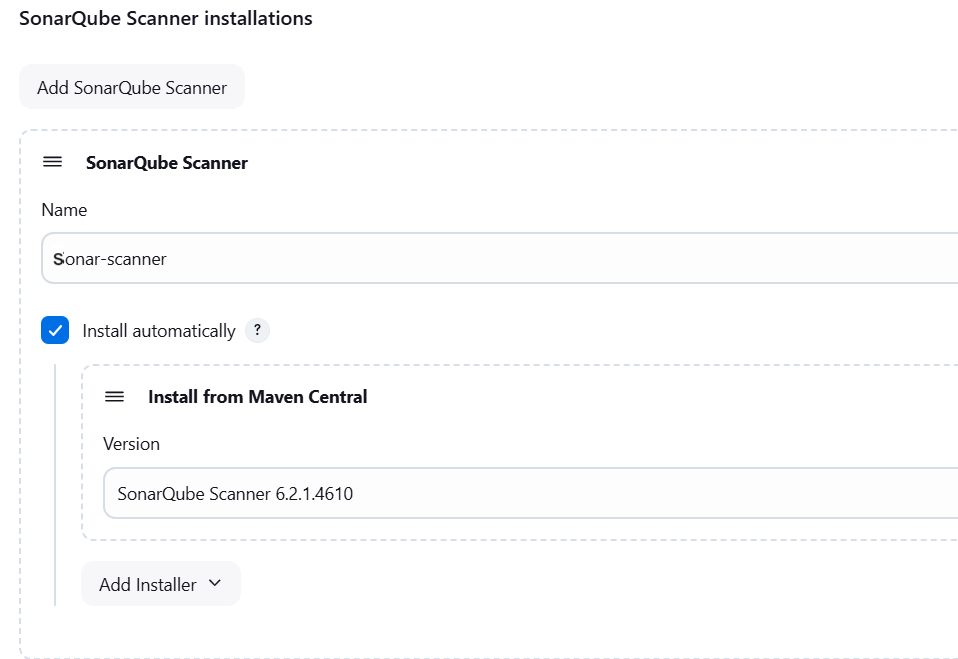
- Node.js (version 16) for JavaScript dependencies.

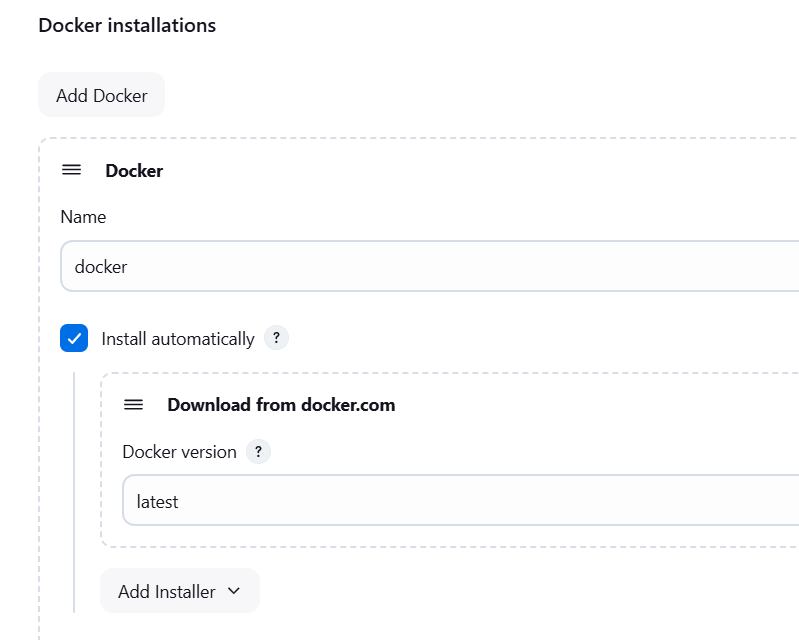
- Docker: Configure installation for Docker.
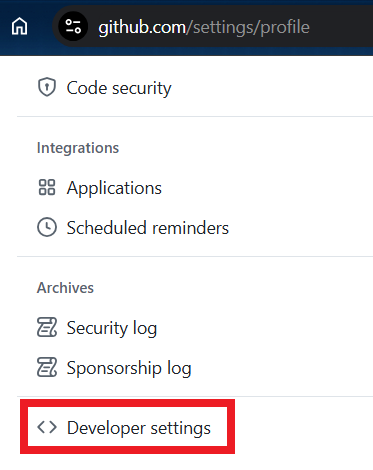
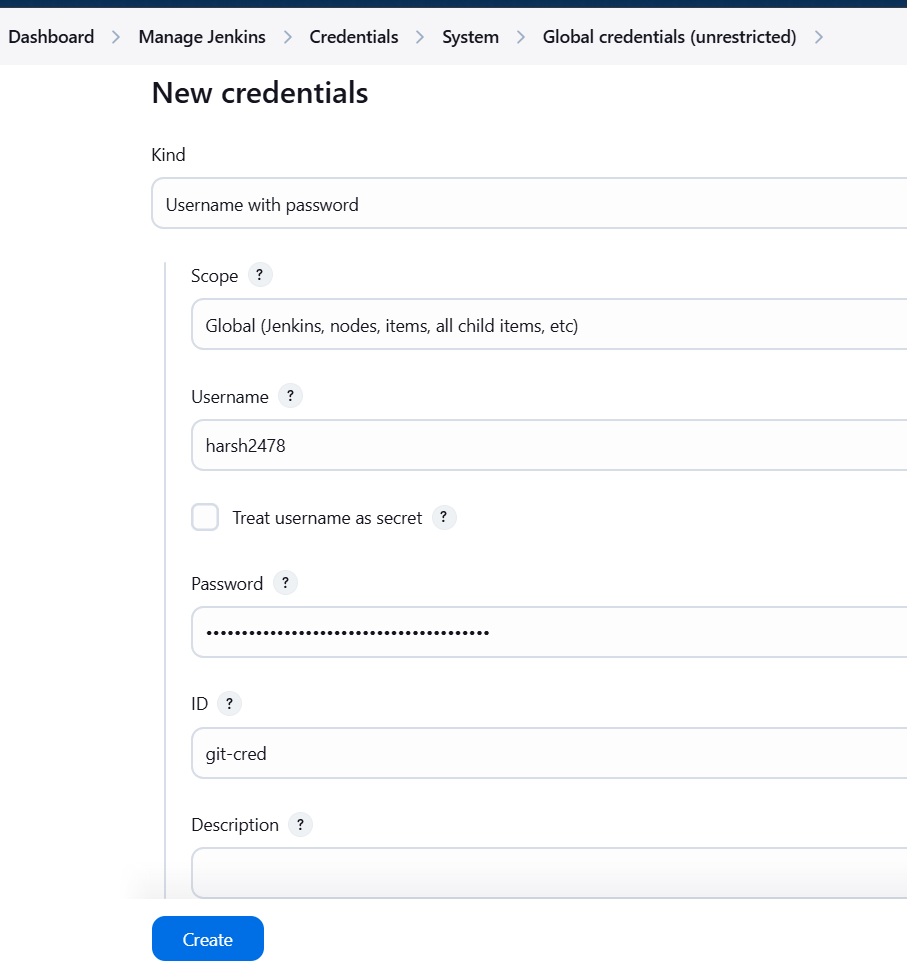
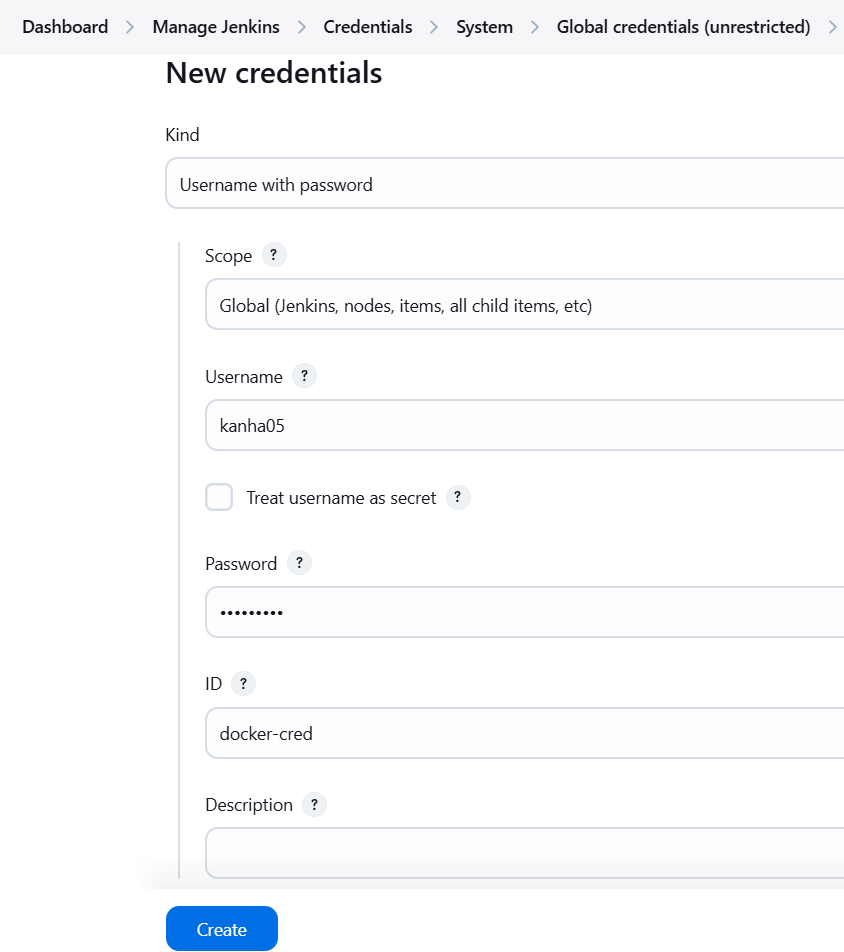
3. Created credentials for GitHub (Personal Access Token), DockerHub, Email App Password and Sonarqube Token.
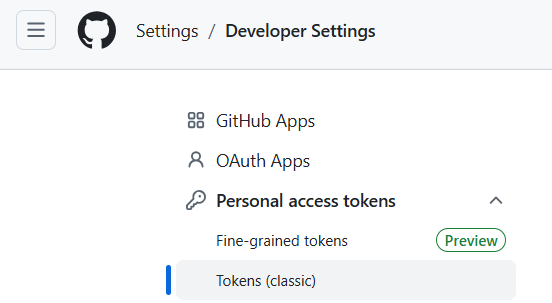
- GitHub: Create a personal access token (
Settings > Developer Settings > Personal Access Tokens) and add it in Jenkins.

- Go back to Jenkins and create new secret for storing it.
- DockerHub: Add your Docker Hub Username and password in Jenkins.
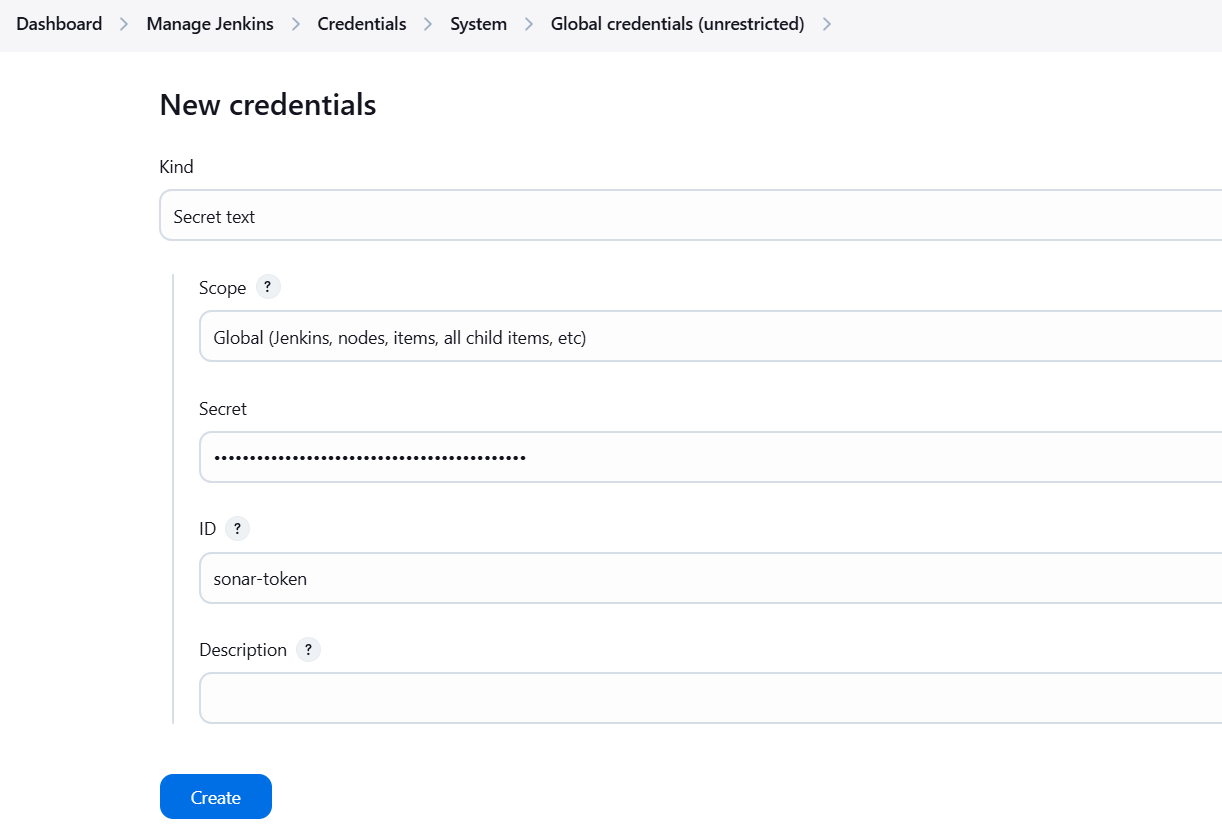
- SonarQube: Generate a token in the SonarQube dashboard and add it in Jenkins.
- Go to
Administration > Security > Users > Administrator > Tokensand generate new token and copy it.


- Create credentials named
sonar-tokenand paste your token there.
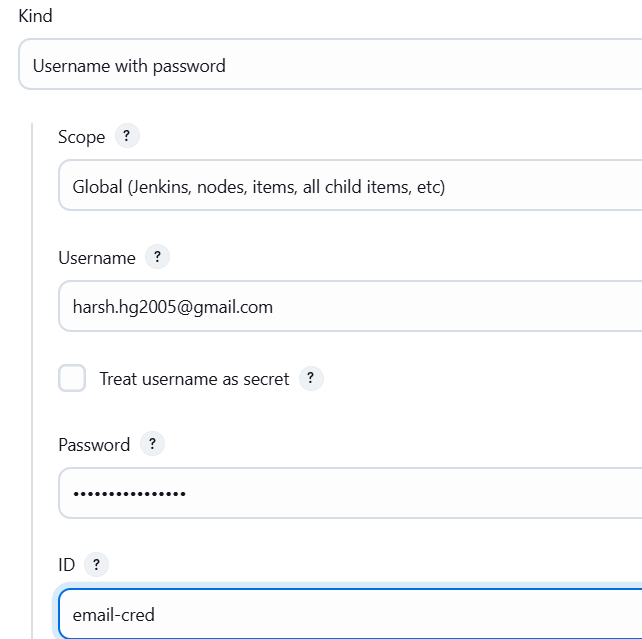
- EMAIL CRED: Go to your google account app password and create new password and copy it.
- Now come back to Jenkins credentials and create new cred.
4. Configured SonarQube URL and token in Jenkins system settings. Go to Dashboard > Manage Jenkins > System.

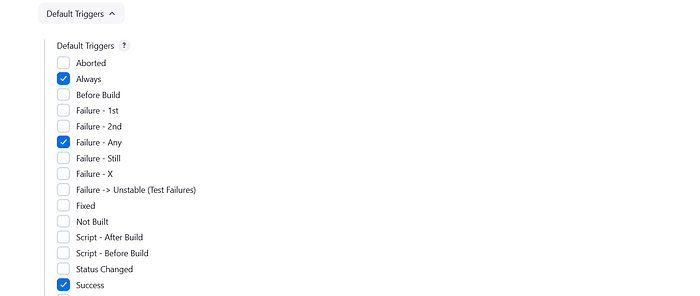
Email Notification Setup
To send build notifications:
- Configured SMTP server settings in Jenkins.
- Enabled “Extended Email Notifications” in the pipeline for customizable HTML reports.

Step 2: Implementing the Jenkins CI/CD Pipeline

pipeline{

    agent any

    tools{
        jdk 'jdk17'
        nodejs 'nodejs16'
    }

    environment{
        SONAR_HOME = tool 'sonar-scanner'
    }

    stages{

        stage('Clean Workspace'){
            steps{
                cleanWs()
            }
        }

        stage('Git Checkout'){
            steps{
                git branch: 'main', credentialsId: 'git-credential', url: 'https://github.com/harsh2478/Prime-Video-Clone-Deployment.git'
            }
        }

        stage('Sonarqube Analysis'){
            steps{
                withSonarQubeEnv('sonar-scanner'){
                    sh '$SONAR_HOME/bin/sonar-scanner -Dsonar.projectKey=amazonprime -Dsonar.projectName=amazonprime'
                }
            }
        }

        stage("Quality Gate"){
            steps{
                script{
                    waitForQualityGate abortPipeline: false, credentialsId: 'sonar-token'
                }
            }
        }

        stage("Installing Dependecies"){
            steps{
                sh 'npm install'
            }
        }

        stage("Trivy scan"){
            steps{
                sh 'trivy fs . > trivy-output.txt'
            }
        }

        stage("Build Docker Image") {
            steps {
                script {
                    withDockerRegistry(credentialsId: 'docker-cred') {
                        sh 'docker build -t kanha05/amazon-prime:$BUILD_NUMBER .'
                    }
                }
            }
        }

        stage("Push Docker Image"){
            steps {
                script {
                    withDockerRegistry(credentialsId: 'docker-cred') {
                        sh 'docker push kanha05/amazon-prime:$BUILD_NUMBER'
                    }
                }
            }
        }

        stage("Docker-Scout Image"){
            steps{
                script{
                    withDockerRegistry(credentialsId: 'docker-cred'){
                        sh 'docker-scout quickview kanha05/amazon-prime:$BUILD_NUMBER'
                        sh 'docker-scout cves kanha05/amazon-prime:$BUILD_NUMBER'
                        sh 'docker-scout recommendations kanha05/amazon-prime:$BUILD_NUMBER'
                    }
                }
            }
        }

        stage("Testing Deploy to Docker Container"){
            steps{
                script{
                    withDockerRegistry(credentialsId: 'docker-cred'){
                        sh 'docker run -d --name prime-video -p 3001:3000  kanha05/amazon-prime:$BUILD_NUMBER'
                    }
                }
            }
        }

        stage("Deployment to Production"){
            environment {
                GIT_REPO_NAME = "Prime-Video-Clone-Deployment"
                GIT_USER_NAME = "harsh2478"
            }
            steps {
                withCredentials([string(credentialsId: 'git-cred', variable: 'GITHUB_TOKEN')]){
                    sh '''
                        git config user.email "harsh.hg2005@gmail.com"
                        git config user.name "Harsh Gupta"
                        BUILD_NUMBER=${BUILD_NUMBER}
                        cp Kubernetes-development/* K8S-Production/
                        sed -i "s/replaceImageTag/${BUILD_NUMBER}/g" K8S-Production/Deployment.yaml
                        git add K8S-Production/
                        git commit -m "Update Deployment Manifest for Production"
                        git push @github.com/${GIT_USER_NAME}/${GIT_REPO_NAME">https://${GITHUB_TOKEN}@github.com/${GIT_USER_NAME}/${GIT_REPO_NAME} HEAD:main
                    '''
                }
            }
        }
    }
    post {
    always {
        emailext attachLog: true,
            subject: "'${currentBuild.result}'",
            body: """
                <html>
                <body>
                    <div style="background-color: #FFA07A; padding: 10px; margin-bottom: 10px;">
                        <p style="color: white; font-weight: bold;">Project: ${env.JOB_NAME}</p>
                    </div>
                    <div style="background-color: #90EE90; padding: 10px; margin-bottom: 10px;">
                        <p style="color: white; font-weight: bold;">Build Number: ${env.BUILD_NUMBER}</p>
                    </div>
                    <div style="background-color: #87CEEB; padding: 10px; margin-bottom: 10px;">
                        <p style="color: white; font-weight: bold;">URL: ${env.BUILD_URL}</p>
                    </div>
                </body>
                </html>
            """,
            to: 'harsh.hg2005@gmail.com',
            mimeType: 'text/html',
            attachmentsPattern: 'trivy-output.txt'
        }
    }
}
Pipeline Stages
The following pipeline stages were implemented:
- Clean Workspace:
Ensures that each build starts with a clean slate to avoid conflicts.
cleanWs()2. Git Checkout:
Clones the repository’s main branch using GitHub credentials.
git branch: 'main', credentialsId: 'git-credential', url: 'https://github.com/harsh2478/Prime-Video-Clone-Deployment.git'3. SonarQube Analysis
Scans the codebase for bugs, vulnerabilities, and code smells using SonarQube.
withSonarQubeEnv('sonar-scanner') {
    sh '$SONAR_HOME/bin/sonar-scanner -Dsonar.projectKey=amazonprime -Dsonar.projectName=amazonprime'
}
4. Quality Gate
Waits for SonarQube’s quality gate results to ensure the code meets security and quality standards.
script {
    waitForQualityGate abortPipeline: false, credentialsId: 'sonar-token'
}
Quality gates in SonarQube are a set of conditions that determine if a project’s code meets the required quality level. With this step, we need to done one more step, i.e, adding a webhook in sonarqube.
When using webhooks in SonarQube and Jenkins, a webhook is configured in SonarQube to call back into Jenkins. This allows the pipeline to either continue or fail based on the results of the analysis.
Go to Administration > Configuration > Webhooks.


URL -> <Jenkins-URL>/sonarqube-webhook .
5. Installing Dependencies:
Installs all application dependencies.
sh 'npm install'6. Trivy Scan:
Performs a file system scan for vulnerabilities and outputs results to a file.
sh 'trivy fs . > trivy-output.txt'7. Build Docker Image:
Builds a container image for the application with a unique tag.
withDockerRegistry(credentialsId: 'docker-cred') {
    sh 'docker build -t kanha05/amazon-prime:$BUILD_NUMBER .'
}
8. Push Docker Image:
Pushes the built image to DockerHub.
withDockerRegistry(credentialsId: 'docker-cred') {
    sh 'docker push kanha05/amazon-prime:$BUILD_NUMBER'
}
9. Docker Scout Image Analysis:
Utilizes Docker Scout for supply chain security, checking for:
- Vulnerabilities (CVEs).
- Recommendations for better security practices.
withDockerRegistry(credentialsId: 'docker-cred') {
    sh 'docker-scout quickview kanha05/amazon-prime:$BUILD_NUMBER'
    sh 'docker-scout cves kanha05/amazon-prime:$BUILD_NUMBER'
    sh 'docker-scout recommendations kanha05/amazon-prime:$BUILD_NUMBER'
}
10. Testing Deploy to Docker Container:
Deploys the container locally for functional testing.
withDockerRegistry(credentialsId: 'docker-cred') {
    sh 'docker run -d --name prime-video -p 3001:3000 kanha05/amazon-prime:$BUILD_NUMBER'
}
11. Deployment to Production:
Updates Kubernetes manifests with the latest image tag, commits them to GitHub, and triggers ArgoCD for deployment.
sed -i "s/replaceImageTag/${BUILD_NUMBER}/g" K8S-Production/Deployment.yaml
git add K8S-Production/
git commit -m "Update Deployment Manifest for Production"
git push ...
12. Post-Build Email Notifications:
Sends build status reports via email with logs and Trivy scan results.
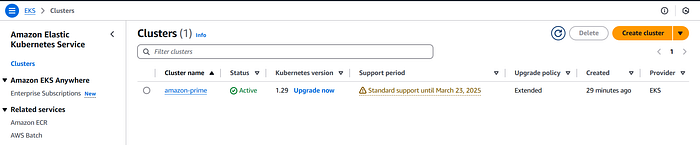
Step 4: Setting Up Amazon EKS and ArgoCD
Amazon EKS
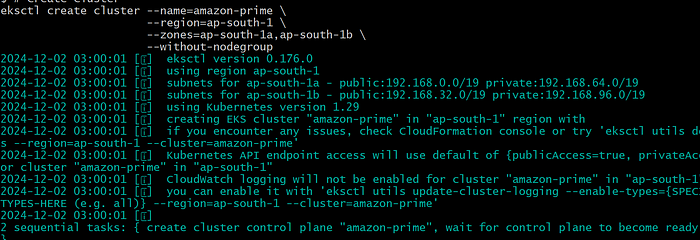
Provisioned a Kubernetes cluster using eksctl:
# Create Cluster
eksctl create cluster --name=<name> \
                      --region=<region-code> \
                      --zones=ap-south-1a,ap-south-1b \
                      --without-nodegroup


# Get List of clusters
eksctl get cluster


# To enable and use AWS IAM roles for Kubernetes service accounts on our EKS cluster, we must create & associate OIDC identity provider.
eksctl utils associate-iam-oidc-provider \
    --region region-code \
    --cluster <cluter-name> \
    --approve


# Create Public Node Group
eksctl create nodegroup --cluster=amcdemo \
                       --region=us-east-1 \
                       --name=amcdemo-ng-public1 \
                       --node-type=t3.medium \
                       --nodes=2 \
                       --nodes-min=2 \
                       --nodes-max=4 \
                       --node-volume-size=20 \
                       --ssh-access \
                       --ssh-public-key=<public-key-name> \
                       --managed \
                       --asg-access \
                       --external-dns-access \
                       --full-ecr-access \
                       --appmesh-access \
--alb-ingress-access - Replace
<name>, <region-code>, <cluster-name>, <public-key-name>with their appropriate values.

ArgoCD Deployment
- Installed ArgoCD in the EKS cluster.
kubectl create namespace argocd
kubectl apply -n argocd -f https://raw.githubusercontent.com/argoproj/argo-cd/stable/manifests/install.yaml

- Access Dashboard by port-forwarding. Copy password first.


2. Created an ArgoCD application pointing to the K8S-Production/ folder in the GitHub repo.
apiVersion: argoproj.io/v1alpha1
kind: Application
metadata:
  name: amazon-prime
  namespace: argocd
spec:
  project: default
  destination:
    server: 'https://kubernetes.default.svc'
    namespace: default
  source:
    repoURL: 'https://github.com/harsh2478/Prime-Video-Clone-Deployment.git'
    path: K8S-Production
    targetRevision: HEAD

Step 5: Create Dockerfile & Kubernetes Manifest.
Create Dockerfile, Deployment.yaml, Service.yaml and push them to github repository.
Dockerfile:
FROM node:alpine

# Create working directory
WORKDIR /app

# Copy package files to working directory
COPY *.json /app/

# Install the dependencies
RUN npm install

# Copy all the files on working directory
COPY . /app/

# Expose the app on 3000 port number
EXPOSE 3000

# command to start app
CMD ["npm", "start"]
Deployment:
apiVersion: apps/v1
kind: Deployment
metadata:
  name: amazon-prime
  namespace: default
  labels:
    app: prime-app
spec:
  selector:
    matchLabels:
      app: prime-app
  replicas: 2
  template:
    metadata:
      name: amazon-prime
      labels:
        app: prime-app
    spec:
      containers:
      - name: prime-container
        image: kanha05/amazon-prime:replaceImageTag
        ports:
        - containerPort: 3000
Service:
apiVersion: v1
kind: Service
metadata:
  name: prime-service
  labels:
    app: prime-service
spec:
  selector:
      app: prime-app
  ports:
    - port: 3000
      targetPort: 3000
  type: LoadBalancer
Start Pipeline:


- Copy the hostname and see your application.


Step 6: Observability with Prometheus and Grafana
Prometheus Setup
- Installed Prometheus on a dedicated VM.
- First, create a dedicated Linux user for Prometheus and download Prometheus:
sudo useradd --system --no-create-home --shell /bin/false prometheus
wget https://github.com/prometheus/prometheus/releases/download/v2.47.1/prometheus-2.47.1.linux-amd64.tar.gz- Extract Prometheus files, move them, and create directories:
tar -xvf prometheus-2.47.1.linux-amd64.tar.gz
cd prometheus-2.47.1.linux-amd64/
sudo mkdir -p /data /etc/prometheus
sudo mv prometheus promtool /usr/local/bin/
sudo mv consoles/ console_libraries/ /etc/prometheus/
sudo mv prometheus.yml /etc/prometheus/prometheus.yml- Set ownership for directories:
sudo chown -R prometheus:prometheus /etc/prometheus/ /data/- Create a systemd unit configuration file for Prometheus:
sudo vim /etc/systemd/system/prometheus.service- Add the following content to the
prometheus.servicefile:
[Unit]
Description=Prometheus
Wants=network-online.target
After=network-online.target

StartLimitIntervalSec=500
StartLimitBurst=5

[Service]
User=prometheus
Group=prometheus
Type=simple
Restart=on-failure
RestartSec=5s
ExecStart=/usr/local/bin/prometheus \
  --config.file=/etc/prometheus/prometheus.yml \
  --storage.tsdb.path=/data \
  --web.console.templates=/etc/prometheus/consoles \
  --web.console.libraries=/etc/prometheus/console_libraries \
  --web.listen-address=0.0.0.0:9090 \
  --web.enable-lifecycle

[Install]
WantedBy=multi-user.target
Here’s a brief explanation of the key parts in this prometheus.service file:
UserandGroupspecify the Linux user and group under which Prometheus will run.ExecStartis where you specify the Prometheus binary path, the location of the configuration file (prometheus.yml), the storage directory, and other settings.web.listen-addressconfigures Prometheus to listen on all network interfaces on port 9090.web.enable-lifecycleallows for management of Prometheus through API calls.
Enable and start Prometheus:
sudo systemctl enable prometheus
sudo systemctl start prometheus- Verify Prometheus’s status:
sudo systemctl status prometheusYou can access Prometheus in a web browser using your server’s IP and port 9090:
http://<your-server-ip>:9090

Configured node exporter to extract system-level metrics.
- Create a system user for Node Exporter and download Node Exporter:
sudo useradd --system --no-create-home --shell /bin/false node_exporter
wget https://github.com/prometheus/node_exporter/releases/download/v1.6.1/node_exporter-1.6.1.linux-amd64.tar.gz- Extract Node Exporter files, move the binary, and clean up:
tar -xvf node_exporter-1.6.1.linux-amd64.tar.gz
sudo mv node_exporter-1.6.1.linux-amd64/node_exporter /usr/local/bin/
rm -rf node_exporter*- Create a systemd unit configuration file for Node Exporter:
sudo vim /etc/systemd/system/node_exporter.service- Add the following content to the
node_exporter.servicefile:
[Unit]
Description=Node Exporter
Wants=network-online.target
After=network-online.target

StartLimitIntervalSec=500
StartLimitBurst=5

[Service]
User=node_exporter
Group=node_exporter
Type=simple
Restart=on-failure
RestartSec=5s
ExecStart=/usr/local/bin/node_exporter --collector.logind

[Install]
WantedBy=multi-user.target- Enable and start Node Exporter:
sudo systemctl enable node_exporter
sudo systemctl start node_exporter- Verify the Node Exporter’s status:
sudo systemctl status node_exporterYou can access Node Exporter metrics in Prometheus at <your-server-ip>:9100
Added Prometheus scraping jobs in ‘/etc/prometheus.yml’ for:
- Node Exporter:
- job_name: 'node_exporter'
    static_configs:
      - targets: ['localhost:9100']
2. Jenkins:
- job_name: 'jenkins'
  metrics_path: '/prometheus'
  static_configs:
- targets: ['<jenkins-ip>:8080']- The metrics path will be
/metricsif not mentioned.(By-default)

- Check the validity of the configuration file:
promtool check config /etc/prometheus/prometheus.yml- Reload the Prometheus configuration without restarting:
curl -X POST http://localhost:9090/-/reload
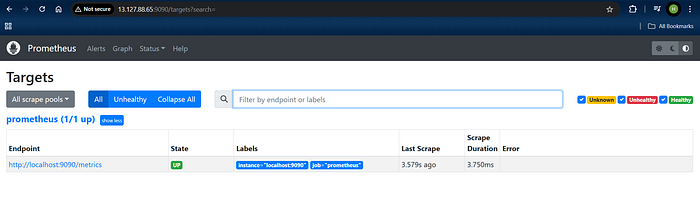
- You can access Prometheus targets at:
http://<your-prometheus-ip>:9090/targets

Grafana Dashboard
- Installed Grafana on the same VM as Prometheus.
- First, ensure that all necessary dependencies are installed:
sudo apt-get update
sudo apt-get install -y apt-transport-https software-properties-common- Add the GPG key for Grafana:
wget -q -O - https://packages.grafana.com/gpg.key | sudo apt-key add -- Add the repository for Grafana stable releases:
echo "deb https://packages.grafana.com/oss/deb stable main" | sudo tee -a /etc/apt/sources.list.d/grafana.list- Install Grafana:
sudo apt-get -y install grafana- To automatically start Grafana after a reboot, enable the service:
sudo systemctl enable grafana-server- Then, start Grafana:
sudo systemctl start grafana-server- Verify the status of the Grafana service to ensure it’s running correctly:
sudo systemctl status grafana-server- Open a web browser and navigate to Grafana using your server’s IP address. The default port for Grafana is 3000.
http://<your-server-ip>:3000

2. Configured Prometheus as a data source.


- Add Your Prometheus Server URL.

- Click on
Save

3. Created dashboards for:
- Jenkins CI/CD performance:

- Paste the Jenkins Dashboard ID
9964


- Now you can view your dashboard.

Monitor Kubernetes with Prometheus
Prometheus is a powerful monitoring and alerting toolkit, and you’ll use it to monitor your Kubernetes cluster. Additionally, you’ll install the node exporter using Helm to collect metrics from your cluster nodes.
Install Node Exporter using Helm
To begin monitoring your Kubernetes cluster, you’ll install the Prometheus Node Exporter. This component allows you to collect system-level metrics from your cluster nodes. Here are the steps to install the Node Exporter using Helm:
- Add the Prometheus Community Helm repository:
helm repo add prometheus-community https://prometheus-community.github.io/helm-charts2. Create a Kubernetes namespace for the Node Exporter:
kubectl create namespace prometheus-node-exporter3. Install the Node Exporter using Helm:
helm install prometheus-node-exporter prometheus-community/prometheus-node-exporter --namespace prometheus-node-exporter


4. Create a node-exporter-svc.yml to expose the prometheus-node-exporter service, so that Kubernetes node can be add as job in prometheus.
apiVersion: v1
kind: Service
metadata:
  labels:
    app.kubernetes.io/instance: amazon-prime
  name: node-exporter
  namespace: prometheus-node-exporter
spec:
  ports:
    - name: node-exporter
      port: 9100
      protocol: TCP
      targetPort: 9100
  selector:
    app: node-exporter
type: NodePort- Push it on the github repository in
K8S-Productionpath, so that argocd automatically deploy the resource in cluster.


5. Update your Prometheus configuration (prometheus.yml) to add a new job for scraping metrics from k8S-nodeip:9001/metrics. You can do this by adding the following configuration to your prometheus.yml file:
  - job_name: 'kubernetes'
    metrics_path: '/metrics'
    static_configs:
- targets: ['K8S-node1Ip:9100']- Copy the K8s Node IP :

- Paste it inside
/etc/prometheus.ymlfile.

- Metrics path will remain default one, i.e,
/metrics - Don’t forget to reload or restart Prometheus to apply these changes to your configuration.
curl -X POST http://localhost:9090/-/reload

Enhancing Security with Docker Scout: Key Concepts of DevSecOps Learned
When implementing Docker Scout, I gained an in-depth understanding of several crucial DevSecOps concepts. Here’s the detailed walkthrough of what I learned, step by step, as I integrated and utilized Docker Scout for securing the supply chain:
1. Understanding Application Composition
While building the Amazon Prime Clone application, I realized that:
- One portion of the application is the code manually written by developers. This is typically authored in an IDE (Integrated Development Environment) and continuously analyzed for syntax errors, bugs, and other quality issues.
- The other portion consists of external libraries, modules, or dependencies fetched from external sources (e.g., npm). These libraries bring added functionality but are potential security risks.
2. Security of Manual Code: SAST (Static Application Security Testing)
For the code that developers write themselves, security is enforced through SAST tools like SonarQube.
- What SAST does: Scans for vulnerabilities, logical flaws, or unsafe code patterns in the source code.
- Integration into CI/CD: By running SAST during the pipeline, we ensure early detection of issues before the code reaches the build or deployment phase.
3. Security of External Libraries: SCA (Software Composition Analysis)
The more significant challenge lies in the external libraries, as we have limited control over their code. This is where SCA tools, like Docker Scout, come into play.
Why is SCA important?
- Every application depends on third-party libraries.
- These libraries themselves depend on other libraries (transitive dependencies).
- Any of these dependencies may contain vulnerabilities or be exposed to newly discovered Common Vulnerabilities and Exposures (CVEs).
For example:
If your application uses Library A, and Library A internally uses Library B, then a vulnerability in Library B could expose your entire application to risk.
4. Continuous Monitoring of Dependencies: CVE Checks
Docker Scout helps detect vulnerabilities in both direct and transitive dependencies by continuously monitoring for CVEs.
- Why continuous checks?
- CVEs can be discovered anytime, even after deployment.
- A dependency considered safe today may be flagged tomorrow due to newly reported vulnerabilities.
- Integration with CI/CD: By integrating tools like Docker Scout into Jenkins, we can ensure vulnerabilities are caught early during the build stage.
5. Principle of “Fail Early, Fail Fast”
In DevSecOps, it is critical to catch issues as soon as possible to avoid downstream problems.
- Docker Scout aligns with this principle by scanning container images immediately after they are built in the pipeline.
- If vulnerabilities are found, the pipeline fails, alerting the developer to address the issue before proceeding.
For instance:
If the npm install stage introduces a vulnerable dependency, Docker Scout will flag it during the "Build Docker Image" or "Docker Scout Image Analysis" stages.
6. Supply Chain Attestation
During the build phase, the focus shifts to supply chain security, which ensures that no vulnerabilities are introduced at the dependency level.
- How Docker Scout fits here:
- By analyzing the entire container image (application code + all dependencies), Docker Scout provides insights into potential risks.
- It generates a Software Bill of Materials (SBOM), a comprehensive list of all components, their versions, and metadata.
SBOM serves as a vital document for:
- Identifying vulnerabilities.
- Meeting compliance requirements.
- Ensuring transparency in the supply chain
7. Workflow of Docker Scout in the Pipeline
- Build Stage:
- After the container image is built, Docker Scout scans it.
- Command Used:
docker-scout quickview kanha05/amazon-prime:$BUILD_NUMBER- Provides an overview of image health, vulnerabilities, and security recommendations.
2. Vulnerability Analysis:
- The next step involves identifying CVEs using:
docker-scout cves kanha05/amazon-prime:$BUILD_NUMBER- Outputs a detailed report of all vulnerabilities detected, along with their severity (Critical, High, Medium, Low).
3. Remediation Suggestions:
- Lastly, Docker Scout suggests best practices to mitigate risks:
docker-scout recommendations kanha05/amazon-prime:$BUILD_NUMBER- For example, upgrading a library version or using a different base image with fewer vulnerabilities.
8. Post-Build Runtime Security: DAST (Dynamic Application Security Testing)
After deploying the container for functional testing, another layer of security is applied: DAST.
- Why DAST?: Vulnerabilities may be exposed only during runtime due to misconfigurations, insecure APIs, or unpatched exploits.
- Integration into CI/CD: DAST tools can analyze the running application, test its endpoints, and ensure no runtime vulnerabilities exist.
9. Continuous Improvement with SBOM
The SBOM generated by Docker Scout serves as a blueprint for improving supply chain security:
- Proactive Vulnerability Checks:
Security teams can use SBOM to periodically scan for newly disclosed CVEs. - Transparency and Compliance:
SBOM ensures compliance with regulations like the Executive Order on Improving the Nation’s Cybersecurity.
10. Shifting Security Left
Docker Scout reinforces the Shift Left Principle in security:
What it means:
- Security practices are integrated early in the software development lifecycle, specifically during development and build stages.
Benefits:
- Reduces the cost of fixing vulnerabilities.
- Minimizes the risk of vulnerabilities reaching production.
By integrating Docker Scout in the pipeline, security checks occur during:
- Dependency installation.
- Image building.
- Post-build runtime testing.
11. Real-Time Runtime Analysis
After deploying the image, runtime vulnerabilities may emerge due to:
- Insecure API endpoints.
- Misconfigurations in Docker or Kubernetes.
- Exposure to external threats.
Tools like Trivy and Docker Scout can scan the running container to identify potential runtime risks, completing the DAST process.
12. Developer Remediation Workflow
When Docker Scout flags vulnerabilities:
- Developers receive detailed feedback, including:
- Vulnerable library versions.
- Suggested fixes or alternatives.
- Steps to update the dependencies.
Remediation Example:
If Library A v1.2.3 has a known CVE, Docker Scout might suggest upgrading to Library A v1.3.0.
- Developers update the dependency in
package.json:
"dependencies": {
    "LibraryA": "^1.3.0"
}- Rerun the pipeline to verify the vulnerability has been resolved.
Conclusion:
Implementing a robust DevSecOps framework requires attention to every stage of the software lifecycle, from development to deployment and runtime. Through tools like Docker Scout, we learned to secure the supply chain by analyzing application dependencies, ensuring vulnerabilities were identified and mitigated early in the pipeline.
This integration not only emphasized Static Application Security Testing (SAST) for developer-authored code but also extended to Software Composition Analysis (SCA) for external libraries, tackling the risks associated with supply chain vulnerabilities. The Software Bill of Materials (SBOM) provided an essential inventory of dependencies, facilitating proactive monitoring for newly disclosed CVEs and ensuring compliance with industry standards.
This pipeline represents a complete implementation of modern software practices.
Tools Used: Jenkins | Docker | SonarQube | Trivy | Docker Scout | Prometheus | Grafana | ArgoCD | EKS
This project is a testament to the power of combining automation, security, and monitoring for robust, production-ready pipelines.